Display Chart
Advertisement
AstroWin v.3 67
Computer applications need not be always necessarily oriented to perform sophisticated operations and rigorous calculations, and many users take keen interest in understanding themselves and others better with the help of spiritual astrology programs
Advertisement
Stock Aides v.1.5
Stock Aides is a stock charting, analysis, and information retrieval program for Windows. It uses freely available historical and intraday quotes from the Internet as its data sources. It can be used for stocks, ETFs, and market indices.
Seal Report v.1.6
Open and powerful database reporting tool. Seal Report offers a framework for producing every day reports from any database. The product focuses on an easy installation and report design: Once setup, reports can be built and published in a minute.
SuperPie Free HTML5 Pie Chart Library v.1.3
The SuperPie dynamic HTML5 pie chart library makes it easy to display pie charts on your web pages. The colors, size and labels are all customizable using simple Javascript. The SuperPie library is completely free for you to use on your web site.
3D Multi Series Column Chart v.2 1
This applet is designed to take multiple series of numerical data and display the information as a 3D Multi series Column Chart. The applet will automatically size itself to the available area given to it by the HTML form.
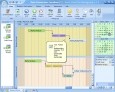
Gantt Chart v.4.2
The Gantt Chart is easy-in-use project plan system. This system allows you to specify complex tasks sequences - a task or multiple tasks can be required to be completed before other tasks can be started. The program has iCalendar import and export.
NextwaveSoft WPF Suite Chart and Gauge
Nextwave Software WPF Suite with WPF Chart and Gauge is a component suite that helps you to visualize your data in Windows Presentation Foundation applications. The suite contains more than 40 2D/3D charts, such as area, bar, column, line, pie, doughnut,

Gantt Chart for Workgroup v.4.2
The Gantt Chart for Workgroup is a powerful project plan system with the additional capability to share data over the network. The program has data import, export, password protection, backup copying and printing features.
Animated Chart Pro v.2.2.1
XML Flash charts allows your to display live data on your website. Animated Chart Pro lets to create and customize XML-driven dynamic flash chart and publish it to website. Area, Bar, Bubble, Column, Doughnut, Line, Pie, Scatter, Radar, Stock charts.
Animated Chart v.2.2.1
Flash charts made easy. Software for generating animated interactive Flash charts and graphs for publishing to websites. Making graphs with Animated Chart is simple and quick and doesn't require any special knowledge of Flash or HTML.
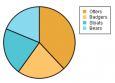
3D Multi Series Pie Chart v.2 1
This applet is designed to take multiple series of numerical data and display the information as a set of 3D Multi series Pie Charts. The applet will automatically size itself to the available area given to it by the HTML form.